Blog
AI Infographic Design: Structure Before Decoration
By Ofrai Editorial (Editorial Team)
An infographic succeeds when a reader understands the relationship between ideas. Generating a polished layout cannot verify the information inside it. Separate research, structure and illustration so each stage has a clear acceptance check.
Choose the relationship you need to show
Use a sequence for ordered steps, a comparison for alternatives, or a hierarchy for parent-and-child ideas. Avoid asking for all three in one image. Write the intended takeaway in one sentence, then remove any element that does not support it. A simple three-step diagram is often easier to review than a crowded poster.
Verify the words before generating
Prepare the exact headings, labels and numbers in a separate document. Decide which source supports each factual claim. For a chart with precise values, use a charting tool to position marks on the correct scale; an image generator should not be trusted to turn a table into mathematically accurate bar heights.
Write a constrained layout prompt
Try: Vertical infographic with three equal panels titled Plan, Generate and Review. Each panel contains one simple original icon and space beneath it for a short caption. White background, navy headings, orange accents, generous margins, clear top-to-bottom reading order. Request only text that you can comfortably inspect, and add longer captions later.
Separate illustration from editable type
Treat the generated image as a draft or illustration layer. Rebuild important labels in a design tool when accuracy, localisation or later updates matter. This makes it possible to correct one number without regenerating every icon. Use consistent font sizes to communicate hierarchy rather than adding more colours.
Review at the destination size
Inspect spelling, panel order, duplicated icons and accidental extra claims. Then view the exported graphic at its mobile display size. If small captions cannot be read, shorten them or publish a companion text explanation. Provide the key information in accessible page text as well as in the image.
Compare how two models handle numbered steps
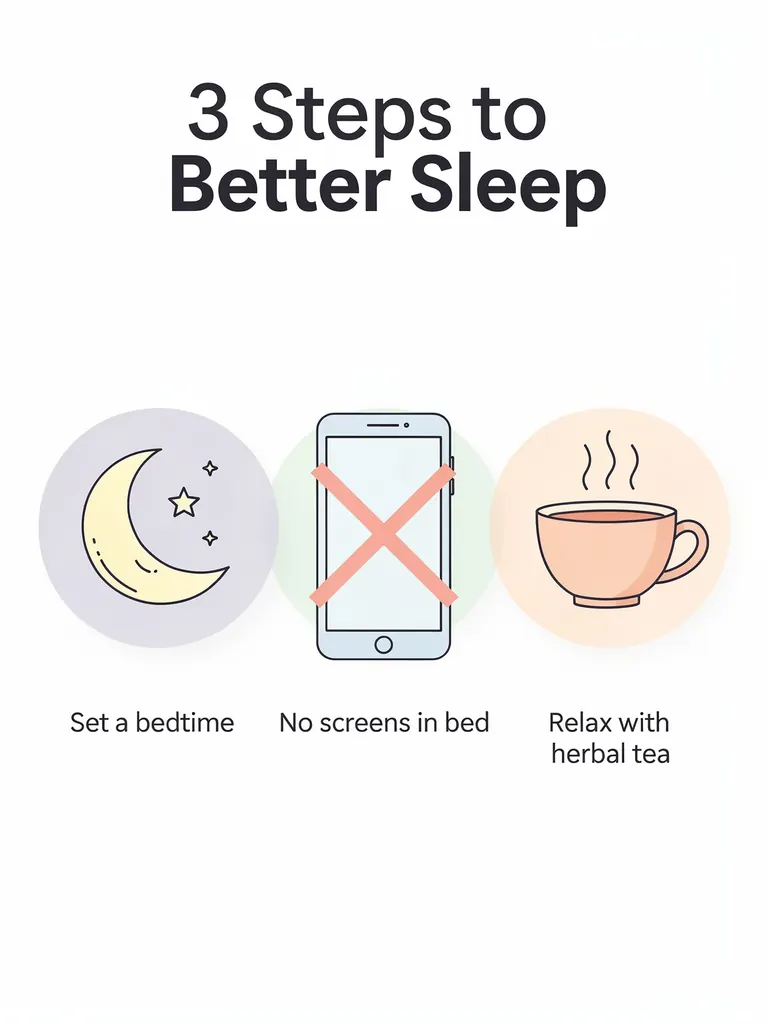
Ofrai test · 2026-10-25 · 1K · 3:4 · one image per model from the same text prompt.
Clean infographic titled "3 Steps to Better Sleep" with three numbered icons — a moon, a phone with a cross, a cup of tea — each with a short label, pastel colours, white background.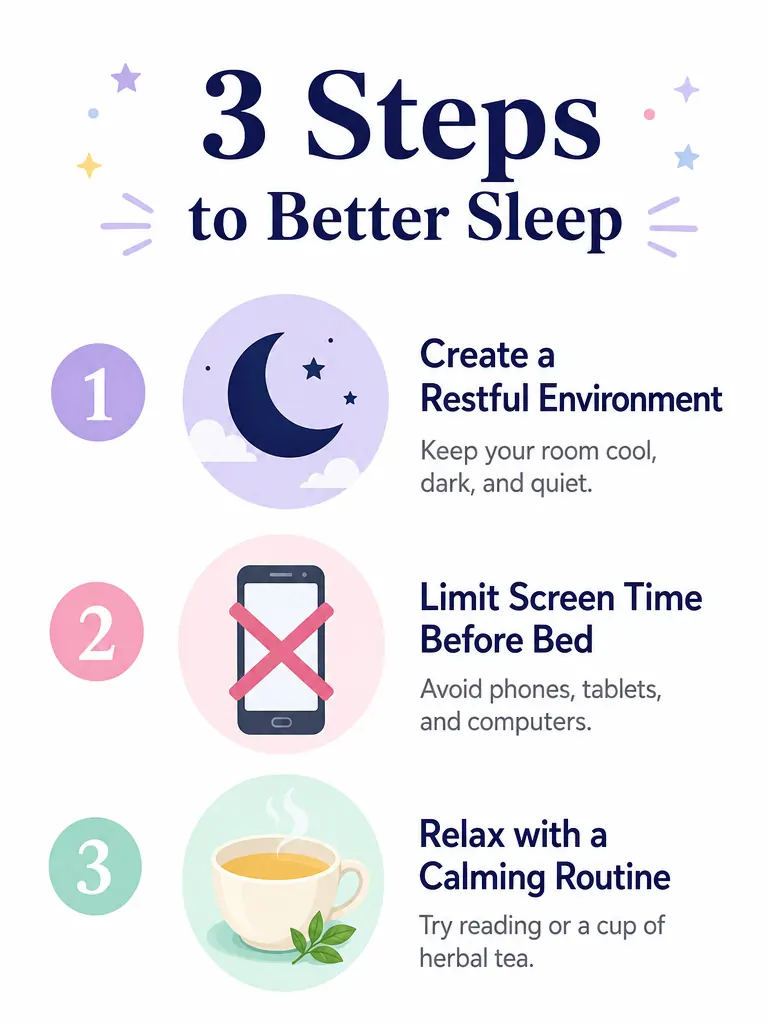
FAQ
- Can AI verify my statistics?
- Image generation does not validate a dataset. Verify the source separately and inspect every displayed value.
- How should I handle a misspelled label?
- Correct important labels in an editable layout. A full regeneration may change elements that were already right.
- Is an infographic suitable for a precise chart?
- Use a proper charting tool for quantitative marks, and reserve generated imagery for explanatory illustration.